Figure 3.
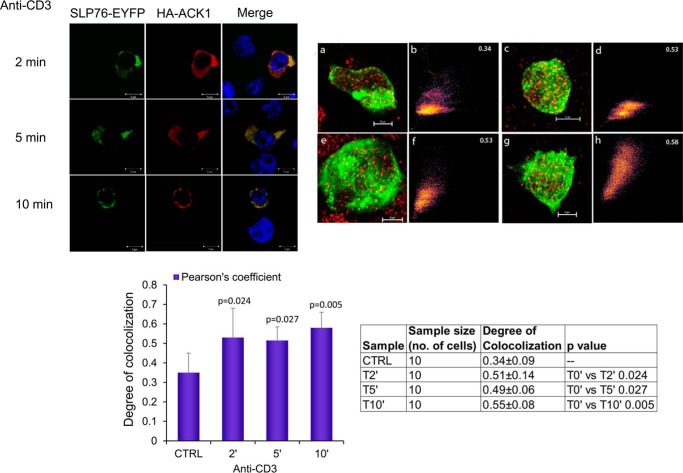
Laser confocal imaging shows that ACK1 co-localizes with SLP-76 in Jurkat T-cells. Left panel, laser confocal images showing co-localization of SLP-76 (green) with ACK1 (red), with nuclear DAPI shown in blue. Cells were treated with anti-CD3 for 2 min (top row) to 10 min (bottom row). Top right panel, 3D projections of deconvolved confocal images of SLP-76 (green) and ACK1 (red) in T cells. a, c, e, and g, confocal microscope images of Jurkat T cells treated with anti-CD3 for 0, 2, 5, and 10 min, respectively. Each image is an overlay of green (SLP-76-EYFP) and red (HA-ACK1). b, d, f, and h, 2D co-localization histograms at 0, 2, 5, and 10 min, respectively. Pearson's correlation coefficient value is shown in the top right corners. Bottom right panel, mean degree of colocalization ± S.D. Data were statistically analyzed using one-way analysis of variance. The p values for each treated group represent statistically significant differences compared with the control group (bottom right panel, table). All treated groups show a significant difference compared with the control resting group (0 min), whereas 10 min appears to be most significant (p = 0.005) among all groups. Images are representative of three independent experiments performed in two different laboratories. CTRL, control.

