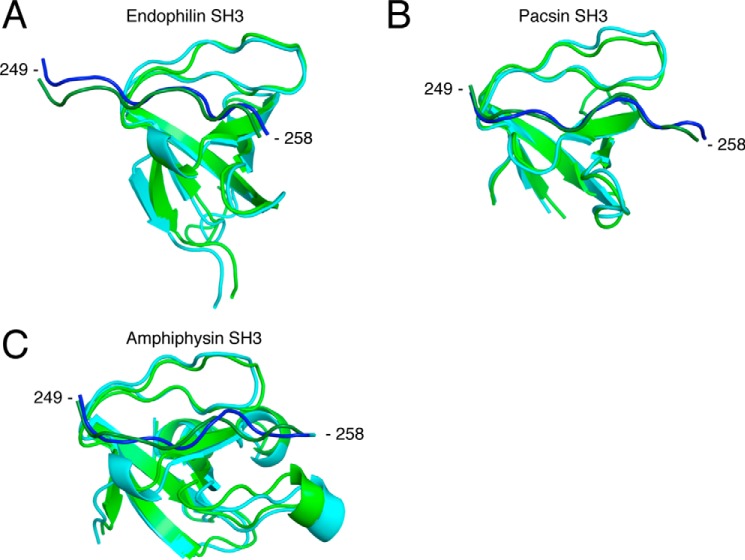
Figure 10.
Structural alignment between the initial complex and the frame corresponding to the centroid from clustered frames post-MD simulations for the endophilin complex (A), for the pacsin complex (B), and for the amphiphysin complex (C). The RMSD cut-off for two structures to be considered neighbors in the GROMOS clustering algorithm was 0.20, 0.17, and 0.13 nm, respectively, for each complex. Shown is a representation of the initial complexes modeled from the Itch PRR (dark green) in complex with β-PIX-SH3′ (green). Blue, frame corresponding to the cluster centroid. Structural alignment and schematic representation were done using PyMOL (Schrödinger) (12, 13, 21, 22, 46).

