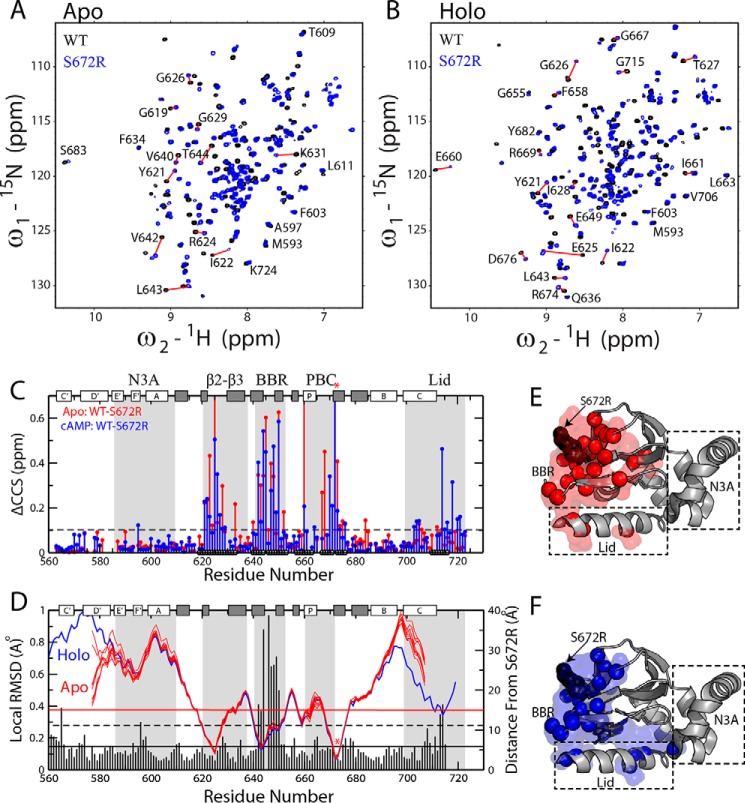
Figure 2.
WT versus S672R chemical shift perturbations in the apo- and holo-HCN4 CBD. Overlay of NH-HSQC spectra for WT (black) and S672R (blue) HCN4(563–724) in the apo (A) and cAMP-bound (B) samples. C, CCS differences between the WT and S672R variant for the apo (red) and cAMP-bound (blue) samples. The black circles along the bottom of the plot depict residues within 15 Å of the mutation site. The protein's secondary structure is depicted along the top as white (α-helices) and gray (β-strands) rectangles, and the BBR and several other motifs are highlighted with gray background. D, residue-specific local WT versus S672R r.m.s.d. values (vertical bars) computed in MOLMOL (56) by aligning three adjacent residues from the WT and S672R cAMP bound X-ray structures (PDB codes 3OTF (8) and 4HBN (20), respectively), as was described previously (27, 41). The solid and dashed black horizontal lines depict the average and average + S.D. r.m.s.d. values, and the horizontal red line represents a 15-Å distance from S672R. The blue and red lines represent the backbone amide nitrogen distances from residue S672(R) for the cAMP bound structure (4HBN) and the apo NMR ensemble (2MNG), respectively. The mutation site (S672R) is highlighted with a red asterisk in both C and D. E and F, residues with CCS changes greater than the dashed line in C were mapped onto the crystal structure as spheres and surface for both the apo (E) and the cAMP-bound (F) samples.

