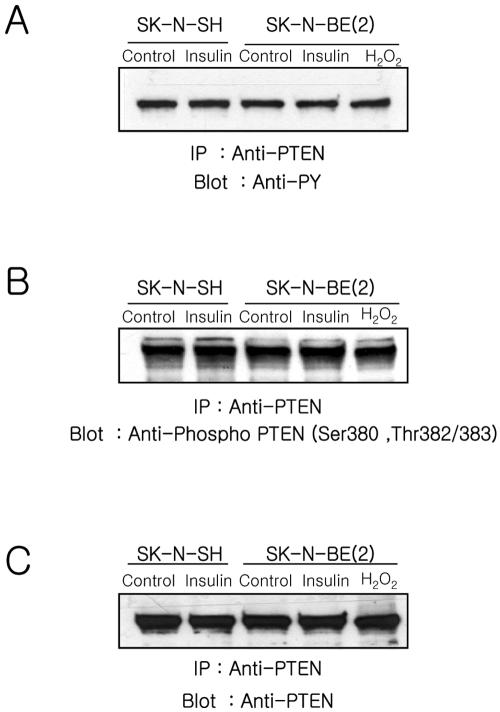
Figure 5.
Analyses of the phosphorylation status of PTEN. Cells were stimulated with insulin (100 nM) or H2O2 (1 mM) for 10 min, lysed, and immunoprecipitated using anti-PTEN (5 μg) as described in Materials and Methods. The anti-PTEN immunoprecipitates were fractionated on a 10% SDS-PAGE, transferred to nitrocellulose, and blotted with anti-phosphotyrosine (4G10) (A), anti-phospho-PTEN (B), and anti-PTEN.

