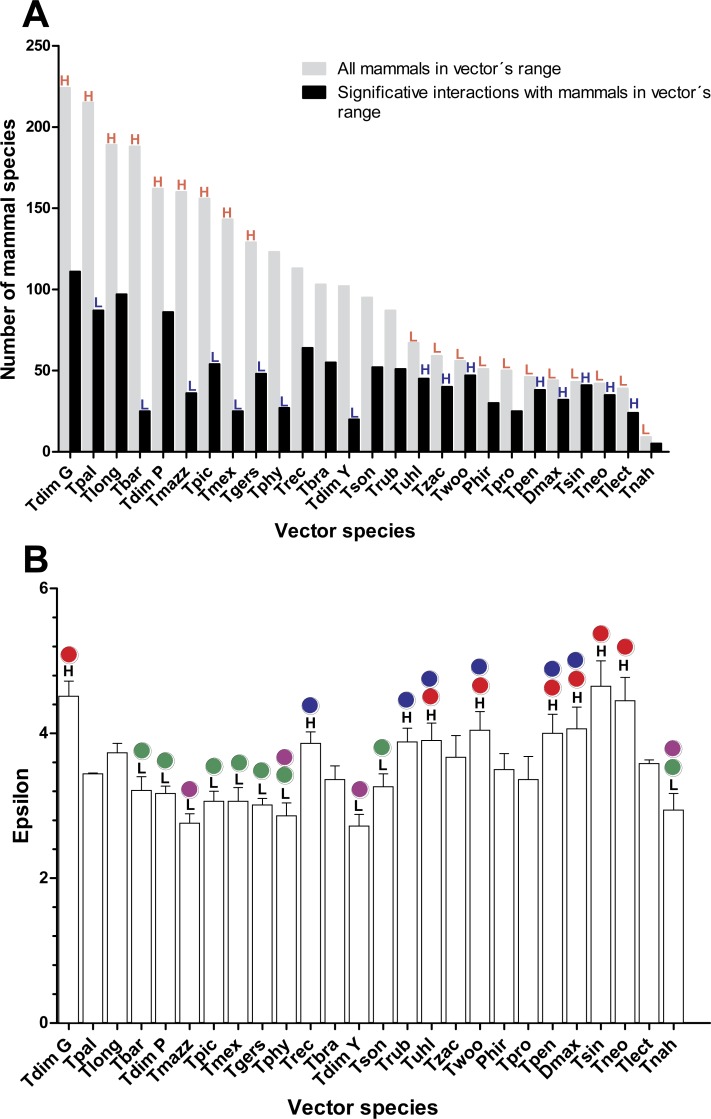
Figure 1. Relation between vector and mammal host species in their distributional range and their corresponding interaction strengths.
(A) Number of mammal species within each vector’s range and the proportion of these with which the vectors had significant links (ε ≥ 1.96). Red letters indicate bars that are above (H) or below (L), the 95% confidence interval (CI) of the average number of mammal richness per vectors’ range. Blue letters indicate those bars that are above (H) or below (L) the 95% CI of the average proportion of mammal species with which vectors had significant links. (B) Mean and standard error of epsilon values for each vector species in their distribution ranges. Black letters indicate the species’ vector that has mean epsilons outside of the 95% CI (H: higher and L: lower). Lack of statistical differences in the epsilon values are indicated for the same color with a P < 0.05. (Red and blue colors are used for lower epsilons, while green and purple are used for higher epsilons).

