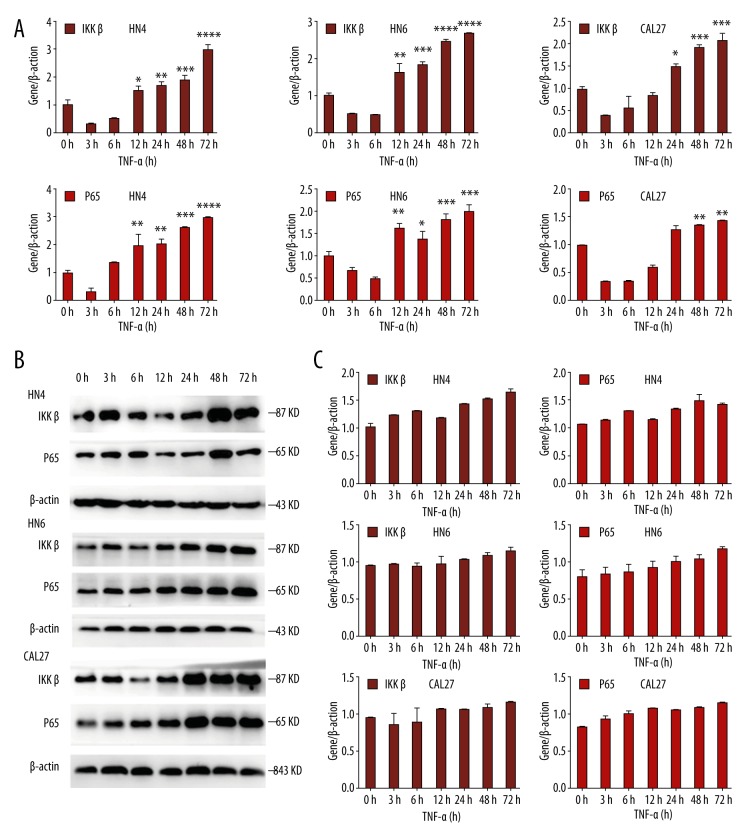
Figure 1.
OSCC cells were treated with TNF-α (10 ng/ml) for the indicated times. (A) The mRNA level of IKKβ and p65 was analyzed by real-time RT-PCR. β-actin was used as a control. (B) Western blot analysis was performed to assess the expression of IKKβ and p65 at the protein level. β-actin was used as a loading control. (C) Statistical analysis of western blot analysis. Each bar represents the mean ±S.D. * P<0.05, ** P<0.05, *** P<0.05, **** P<0.05.

