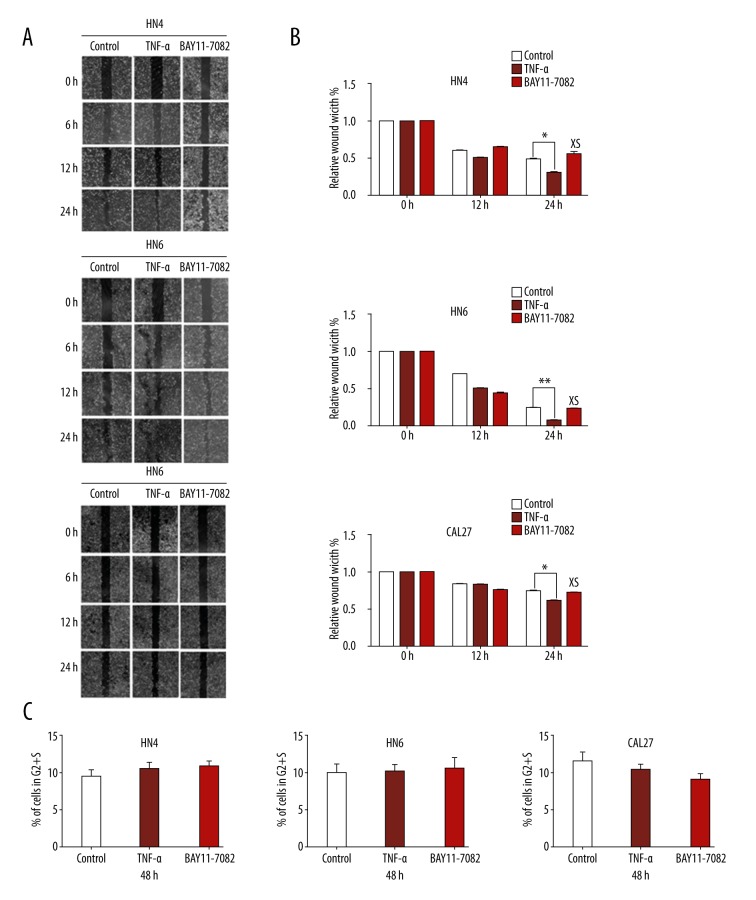
Figure 3.
TNF-α enhanced migration behavior of OSCC cells. (A) Photographs were taken at the same position of the wound at the indicated time points (×40 magnification). (B) Quantitative analysis of cells migration in 12 h and 24 h. The data were calculated as the mean ±S.D.* P<0.05. ** P<0.05; NS – not significant. (C) The flow cytometric cell-cycle analysis showed that there was no significant difference of proliferation ability between the TNF-α treatment group, the BAY11-7082 treatment group, and the nontreatment group, P>0.05.

