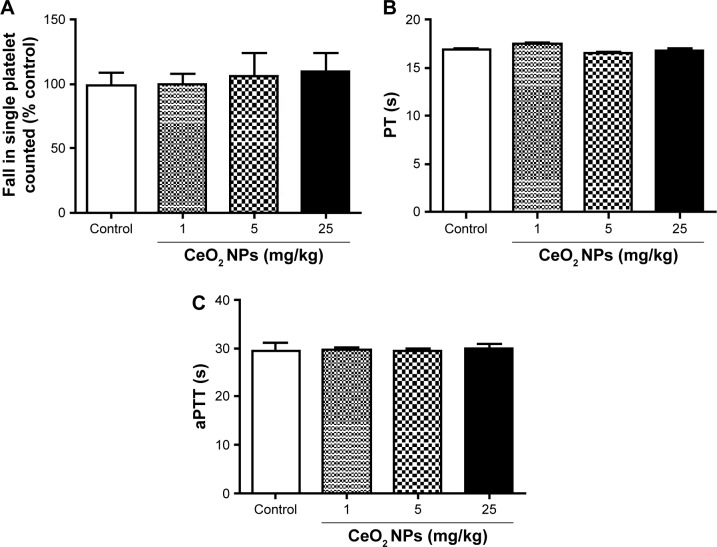
Figure 7.
In vitro platelet aggregation in whole blood (A), prothrombin time (PT) (B), and activated partial thromboplastin time (aPTT) (C) after incubation with either saline or cerium oxide nanoparticles (CeO2 NPs, 1, 5, or 25 μg/mL). Data are mean ± standard error of the mean (n=4–6 in each group).

