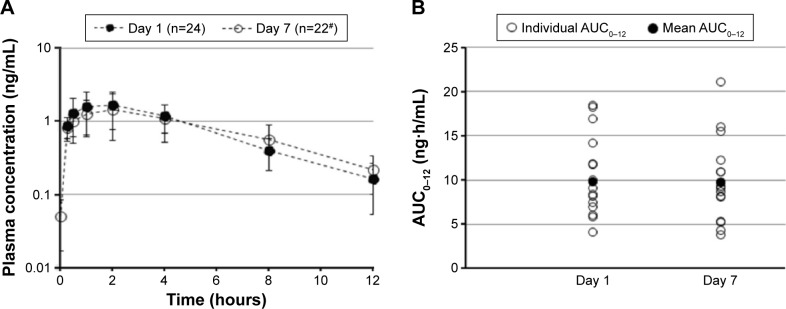
Figure 2.
Mean olopatadine 0.77% plasma concentration over time (A) and AUC0–12 (B) following single-dose (Day 1) and multiple-dose (Day 7) exposure.
Notes: #n=9 at 8- and 12-hour time points due to study consent withdrawal. Data for Day 7 AUC0–12 are from 19 subjects. AUC0–12, area under the plasma concentration–time curve from 0 to 12 hours.

