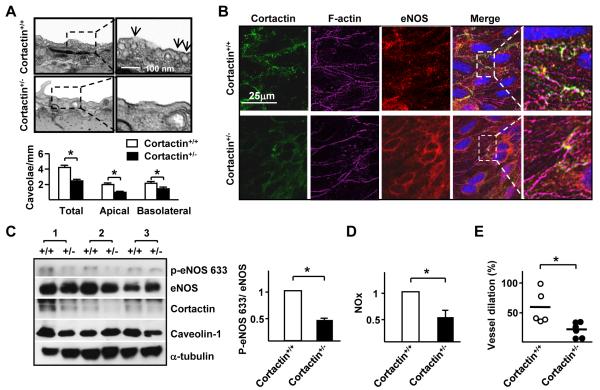
Figure 5. Cortactin-dependent eNOS localization in the mouse aorta.
(A) EM images of aorta isolated from cortactin+/− mice and cortactin+/+ littermates. Bar graph in lower panel shows the levels of caveolae (mean ± SEM from 3 independent experiments) in listed areas. (B) En face immunostaining of cortactin, eNOS, and F-actin in thoracic aortas isolated from cortactin+/+ and cortactin+/− mice. The additive yellow color indicates colocalization of cortactin, eNOS, and F-actin. (C, D) Aortas were isolated from cortactin+/+ and cortactin+/− mice (n=3 in each group) and tissue was lyzed. In (C), aortic extracts were analyzed by immunoblotting with indicated antibodies. In (D) NO production was measured. Data are mean ± SEM from at least 3 sets of experiments. (E) Flow-induced vasodilation ex vivo in cerebellar microvessels from cortactin+/+ (n = 5) and cortactin+/− (n = 6) mice pre-treated with phenylephrine (1 μM). The vessel dilation % is defined as the percentage of the diameter change of the flow-induced dilation compared with the diameter change of the phenylephrine-induced constriction. ‘*’ indicates P < 0.05.

