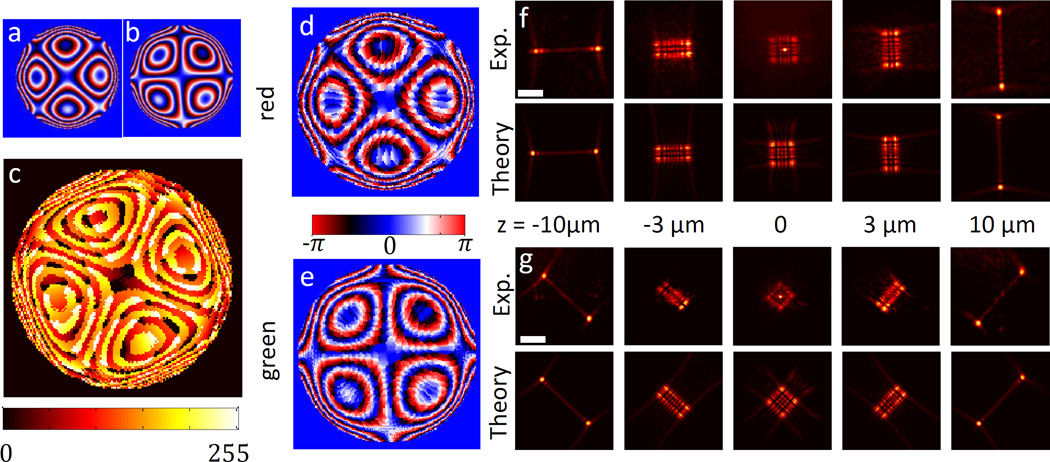
Figure 2. Dual-colour 20µm Tetrapod mask.
a, Desired phase pattern for red (699 nm). b, Desired phase pattern for green (559 nm) c, Resulting SLM voltage pattern from design algorithm. d, Calculated phase delay experienced by red wavelength and e, by green wavelength. f, Experimentally measured PSF for a 40 nm red microsphere, in a 20 µm z-range (top), and theoretically calculated desired PSF, corresponding to a (bottom). g, Experimentally measured PSF for a 100 nm green microsphere, in a 20 µm z-range (top), and theoretically calculated desired PSF, corresponding to b (bottom). Scale bar is 5 µm.

