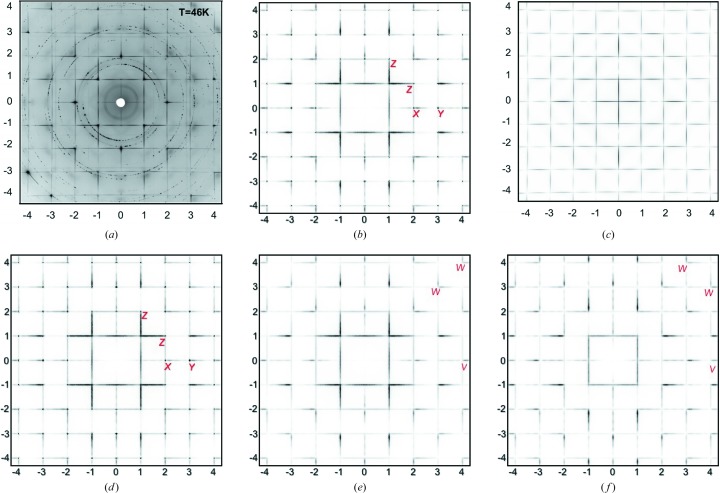
Figure 8.
Comparison of results for the final model of the present work with the work of Izquierdo et al. (2011 ▸). (a) Observed X-ray data and (c) Izquierdo’s ‘best-fit’ model [both reproduced with permission from Izquierdo et al. (2011 ▸), copyright (2011) Elsevier]. (b) The hk0 diffraction pattern calculated using δBa = 0.40, ξHg = 0.04 and ξBa = 0.02. (d) The same as part (b) but with the ξBa term omitted. Parts (e) and (f) show, respectively, (hk
 ) and (hk1.0) patterns calculated for the same model as part (b).

