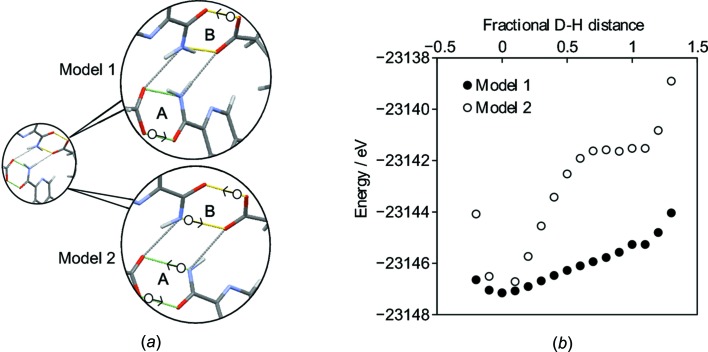
Figure 6.
(a) Schematic showing the H atoms that were moved in tandem along the vector between the H atom and its acceptor atom to form Model 1 and Model 2. The white circles indicate the initial position of the H atoms from the XRD structure and the arrows indicate the direction of movement. (b) The energy of NPX–PA as a function of H-atom position. A fractional distance of 0 corresponds to the DFT-optimized XRD position, while a distance of 1 corresponds to the H atom being at the equivalent position on the other side of the hydrogen bond. Negative fractional distances correspond to movement towards the donor atom.

