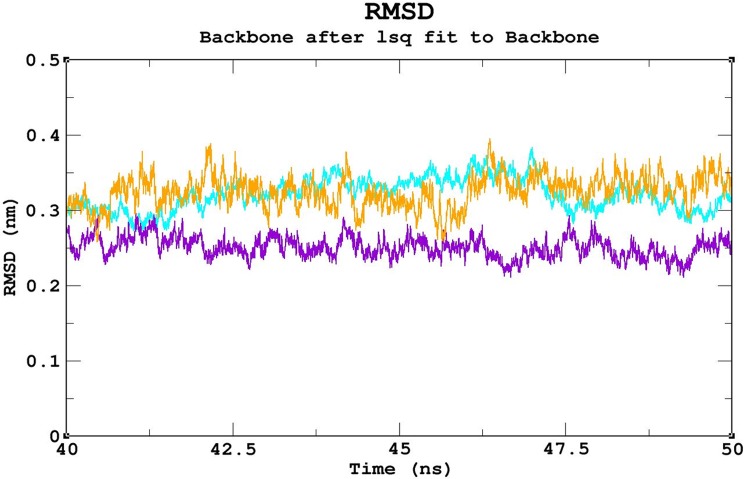
Fig 3. Block-based RMSD analysis of the native protein-DNA complex.
Color scheme: run 1 (orange), run 2 (violet), and run 3 (cyan). For triplicate runs, trajectory files between 40ns and 50ns were used to elucidate the pattern with the greatest convergence. Trajectory run 2 (violet) shows the best convergence pattern.

