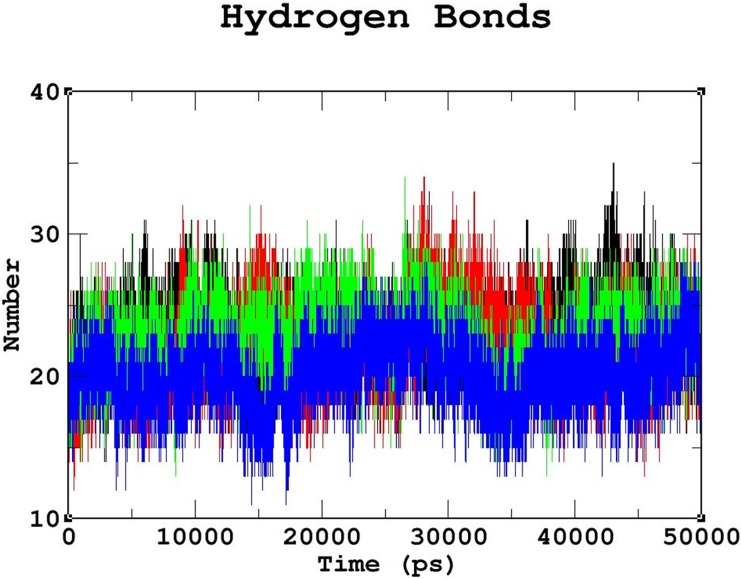
Fig 5. Number of intermolecular hydrogen bonds formed between the protein and DNA in the native and mutant complexes.
Color scheme: native (black), R131W (red), R131Q (green), and R203C (blue).The R203C mutant complex formed the least number of intermolecular hydrogen bonds throughout the simulation period compared to the native complex, followed by the R131Q mutant complex. The R131W mutant complex formed less number of intermolecular hydrogen bonds than the native complex but more than the R131Q and R203C mutant complexes.

