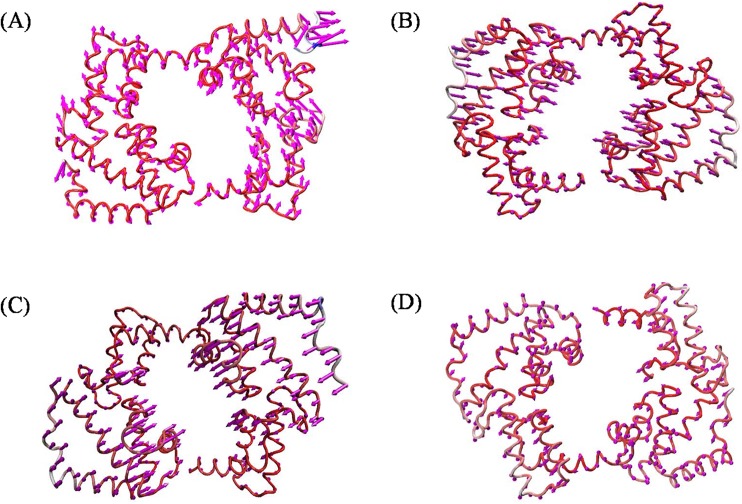
Fig 7. Porcupine plots of the PCA analysis depicting the movement and altitude of the C-alpha atoms throughout the 50 ns simulation in the native and mutant complexes.
(A) Native, (B) R131W, (C) R131Q, and (D) R203C mutant complexes. The direction of the arrows indicates the direction of movement of the protein, and the length of the arrows indicates the magnitude of the motion. The R203C mutant complex showed the least difference in motion throughout the simulation compared to the native and other mutant complexes.

