Figure 2.
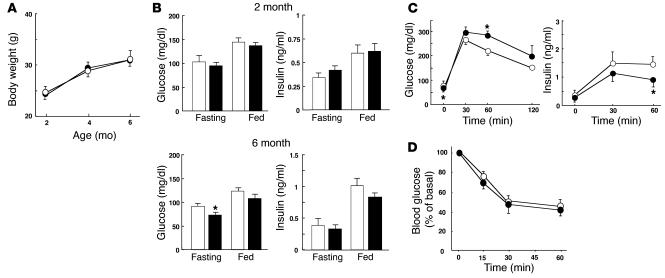
Effect of β cell–specific ablation of PKCλ on glucose metabolism. (A) Growth curves of control (open circles) and βPKCλ–/– (filled circles) mice. Mice were weighed at 2, 4, and 6 months. (B) Blood glucose and plasma insulin concentrations of 6-month-old control (white bars) and βPKCλ–/– (black bars) mice in the fasting or fed state. (C) Intraperitoneal glucose tolerance tests performed in control and βPKCλ–/– mice that had fasted overnight. (D) Blood glucose concentrations during insulin tolerance testing in control and βPKCλ–/– mice. Data are means ± SE of values from 25 (A), 28 (B), 10 (C), or 6 (D) animals of each genotype. *P < 0.05 (ANOVA) versus the corresponding value for control mice.

