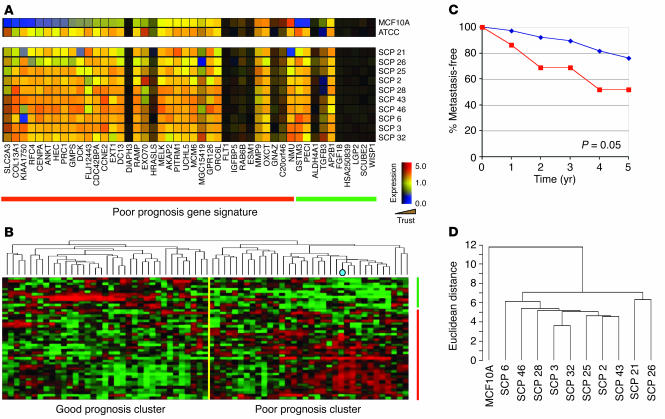
Figure 1.
SCPs from MDA-MB-231 cells have a poor-prognosis gene expression signature. (A) Microarray expression data of 46 of the 70 poor-prognosis genes (7) that are present on the Affymetrix U133A GeneChip for the MCF10A normal breast epithelial cell line, parental MDA-MB-231 cell line, and various SCPs from MDA-MB-231. Each column represents a gene (denoted along the bottom) and each row represents a cell line (denoted along the right). Genes of the poor-prognosis signature that are expressed at higher levels in poor-prognosis tumors are above the red line, and those that are underexpressed are above the green line. Genes with low trust values due to low or absent expression are shaded in darker colors (Trust; wedge). (B) Microarray expression data of primary human breast carcinoma from 63 patients treated at our institution who had at least 5 years of clinical follow-up and/or developed metastatic disease. Hierarchical clustering of the patients’ data was performed with the 46 poor-prognosis genes. Each column represents a patient and each row, a gene. The MDA-MB-231 cell line was included and is denoted by a blue dot in the dendrogram. Those patients in the good-prognosis versus the poor-prognosis cluster are separated by the yellow line. (C) Five-year metastasis-free survival data for the 63 patients classified according to the hierarchical clustering described in B. The P value shown in the graph was calculated by the χ2 test. (D) Dendrogram showing hierarchical clustering of the SCPs and MCF10A using the poor-prognosis genes. A scale of the distance metric used is shown on the left.

