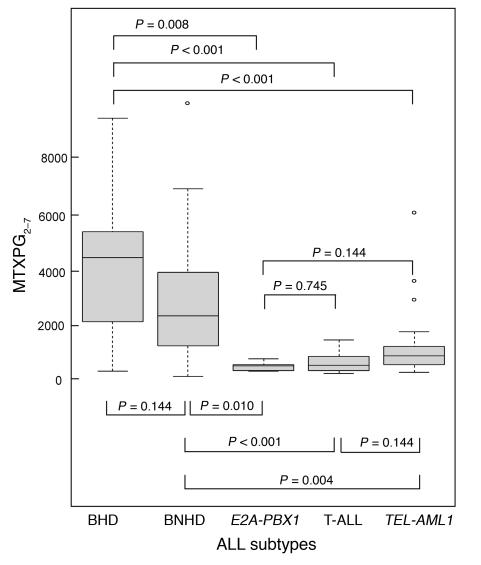
Figure 1.
Box plot of intracellular concentration of total methotrexate polyglutamates (MTXPG2–7) according to ALL subtypes, following in vivo treatment with 1 g/m2 MTX infused over 24 hours. MTXPG accumulation (picomoles per 109 bone marrow ALL cells) is shown for hyperdiploid B-lineage ALL (BHD, n = 19), nonhyperdiploid B-lineage ALL without defined molecular genetic abnormalities (BNHD, n = 39), ALL with E2A-PBX1 fusion (E2A-PBX1, n = 5), T-ALL (n = 14), and ALL with TEL-AML1 fusion (TEL-AML1, n = 24). Medians, quartiles, and ranges excluding outliers (circles) are depicted. P values are from pairwise comparisons using the Wilcoxon rank sum test after adjustment for multiple testing.

