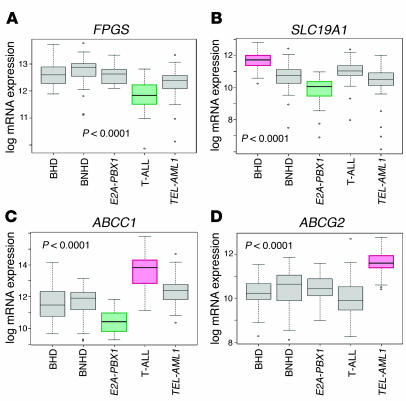
Figure 3.
Gene expression of FPGS and 3 transporters with known MTX transport capacity in ALL subtypes. Box plots with medians, quartiles, and ranges excluding outliers (circles) of log mRNA expression are depicted for folylpolyglutamate synthetase (FPGS) (A), reduced folate carrier (RFC, or SLC19A1) (B), multidrug resistance–associated protein 1 (MRP1, or ABCC1) (C), and breast cancer resistance protein (BCRP, or ABCG2) (D). Data from 197 patients were plotted (BHD, n = 42; BNHD, n = 58; E2A-PBX1, n = 21; T-ALL, n = 35; TEL-AML1, n = 41). P values were determined by the Kruskal-Wallis test. The red boxes indicate subtypes in which gene expression was significantly higher, whereas the green boxes indicate subtypes with significantly lower expression of the gene depicted.

