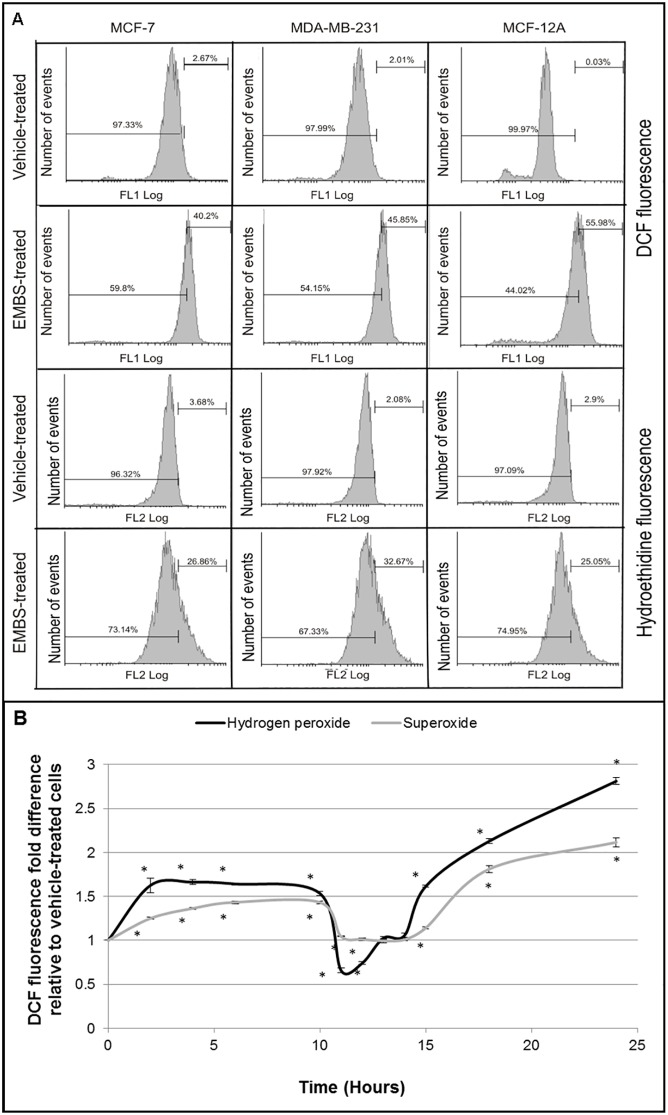
Fig 1. EMBS exposure results in oxidative stress.
(A) Flow cytometry of 2,7-dichlorofluorescein diacetate- and hydroethidine-stained cells to determine the influence of EMBS (0.4 μM, 24 h) exposure on hydrogen peroxide and superoxide production in MCF-7-, MDA-MB-231- and MCF-12A cells. Histograms were gated for positive- and negative staining and the percentage positive cells are included in each graph. (B) MDA-MB-231 cells were exposed to 0.4 μM EMBS for the indicated timepoints. Hydrogen peroxide (dark grey line) and superoxide (light grey line) were measured. The graph represents the average of 3 independent experiments with error bars representing s.e.m. Values represent the fold-change compared to cells at 0 h. An asterisk (*) demonstrates a statistically significant P value <0.05 when compared to vehicle-treated cells.

