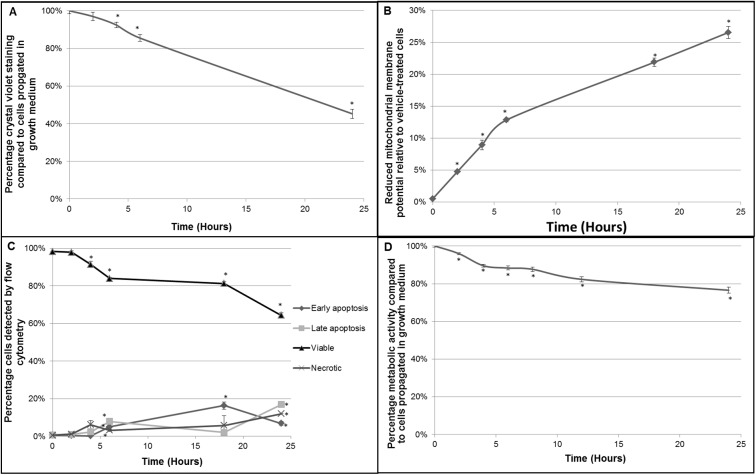
Fig 2. EMBS-treated cells undergo apoptosis correlated with decreased cell viability, metabolic activity and mitochondrial membrane potential.
(A) MDA-MB-231 cells were exposed to 0.4 μM EMBS for the indicated timepoints and stained with crystal violet. The graph represents the average of three independent experiments with error bars representing s.e.m. Values represent the absorbance measurements at 570 nm. An * demonstrates a statistically significant P value <0.05 when compared to vehicle-treated cells. (B) MDA-MB-231 cells were exposed to 0.4 μM EMBS for the indicated timepoints. Subsequently, Mitotracker was quantified using flow cytometry. The graph represents three independent experiments with error bars of s.e.m. Apoptosis was measured relative to vehicle-treated cells. An * demonstrates a statistically significant P value <0.05 when compared to vehicle-treated cells. (C) Annexin V/PI staining was used to determine the number of viable (▲), necrotic (X), early- (♦) and late apoptotic cells (■) at different timepoints after EMBS exposure. The graph represents the average of three independent experiments with error bars representing s.e.m. An * demonstrates a statistically significant P value <0.05 when compared to vehicle-treated cells. (D) To measure metabolic activity cells were exposed to EMBS and simultaneously incubated with Alamar blue. At indicated timepoints Alamar Blue was measured and the percentage reduction in exposed cells was calculated relative to that in control cells. The graph represents the average of three independent experiments with error bars representing s.e.m. An * demonstrates a statistically significant P value <0.05 when compared to vehicle-treated cells.

