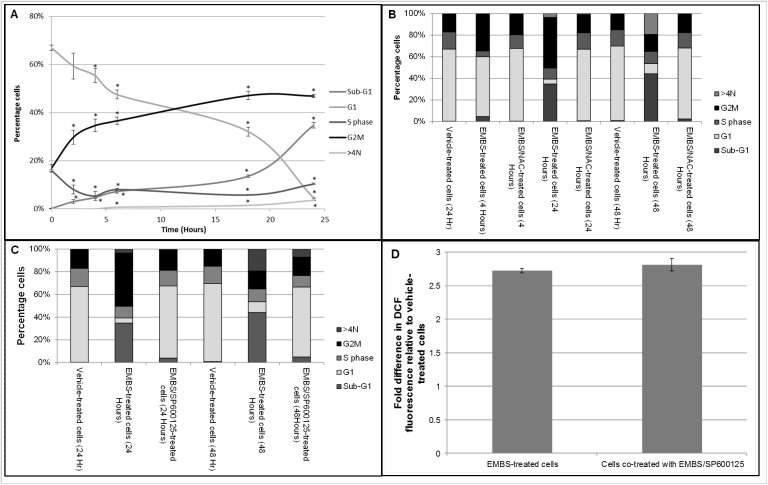
Fig 4. EMBS induces ROS/JNK-dependent apoptosis, G2/M block and endoreplication.
(A) Cell cycle progression was analysed using PI in cells treated with EMBS alone, EMBS together with NAC or EMBS together with the JNK inhibitor, SP600125. The graph represents three independent experiments showing the percentage of cells in each of five categories. Error bars represent s.e.m. An * demonstrates a statistically significant P value of <0.05 when compared to vehicle-treated cells. (B) Cell cycle progression analysis of analysis of EMBS-treated MDA-MB-231 cells in the presence or absence of NAC after 4 h, 24h and 48 h. The graph represents three independent experiments showing percentage of cells in each of four categories. (C) Cell cycle progression analysis of analysis of EMBS-treated MDA-MB-231 cells in the presence or absence of Jnk inhibitor (SP600125) after 4 h, 24 h and 48 h. The graph represents three independent experiments showing percentage of cells in each of four categories. (D) Flow cytometry was conducted to investigate if JNK inhibition influences EMBS-induced ROS production. Cells were either treated with 0.4 μM EMBS for 24 h in the presence or absence of the JNK inhibitor (SP600125) after which DCF fluorescence was measured. The graph represents the average fold change between treated and vehicle-treated cells of 3 independent experiments with error bars representing s.e.m.

