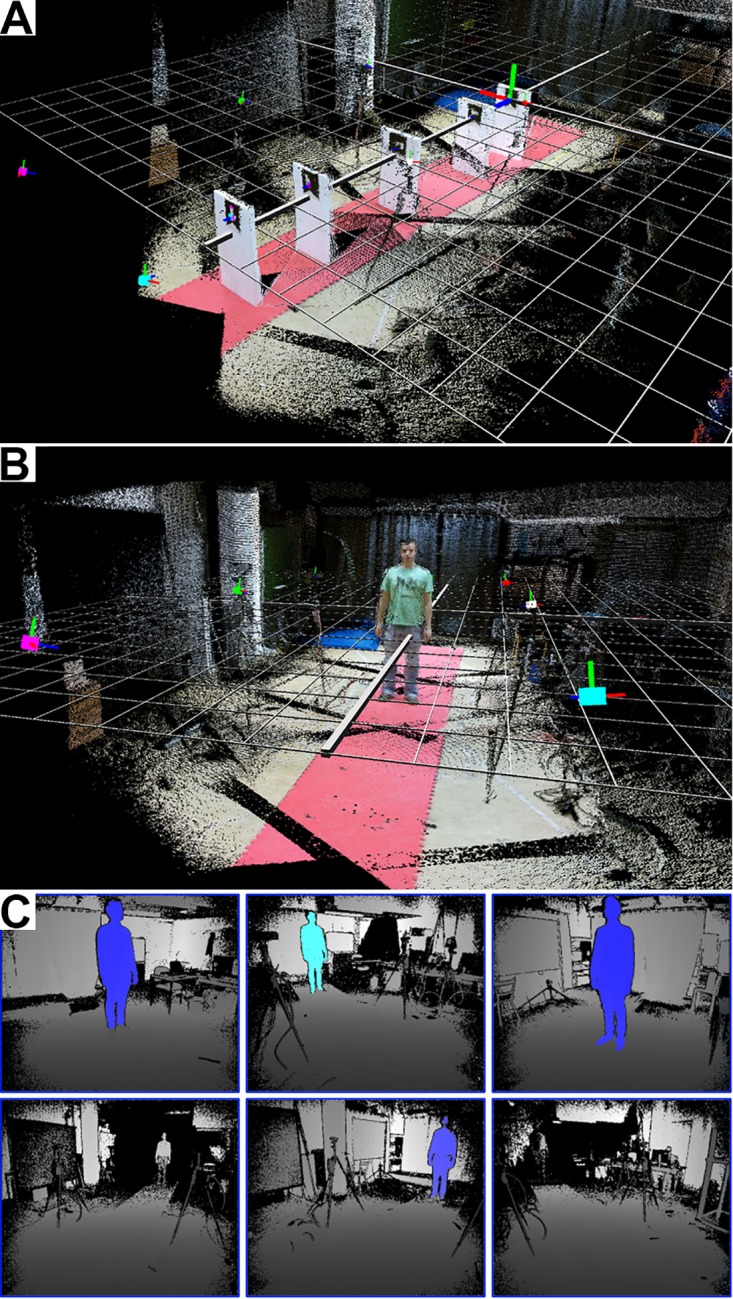
Fig 2. Screenshots of the server program.

(A-B) Three-dimensional point clouds of six Kinect sensors after spatial calibration. Each point is represented as tiny cube with the color of the corresponding the pixel in the color image. The big colored cubes indicate the Kinect sensors. The red, green and blue lines attached to the colored boxes (sensors) indicate the axes of local coordinate system. Notice that the edge of the red coating on the floor is very straight, which illustrates the precise spatial calibration. (A) The marker in the very back is the marker with id 1 and represents the origin of the global coordinate system which is indicated by the grid. (B) A subject standing in the tracking volume to visualize the dimensions. (C) Screenshot of the live depth images view. The tracked body is highlighted. By walking through the tracking volume one can easily identify blind spots.
