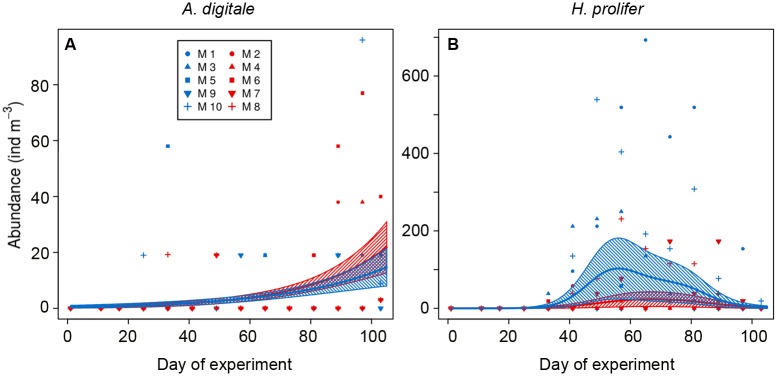
Fig 5. Hydromedusae abundances along the study period.
A) A. digitale, B) H. prolifer. Colour code: red = treatment (~760 μatm pCO2), blue = control (ambient conditions). M = mesocosms. Solid lines = prediction from Generalized Additive Mixed Models (GAMMs) (smoother trends p-value < 0.05), with the ambient and high-pCO2 mesocosms shown separately; striped area = confidence interval.

