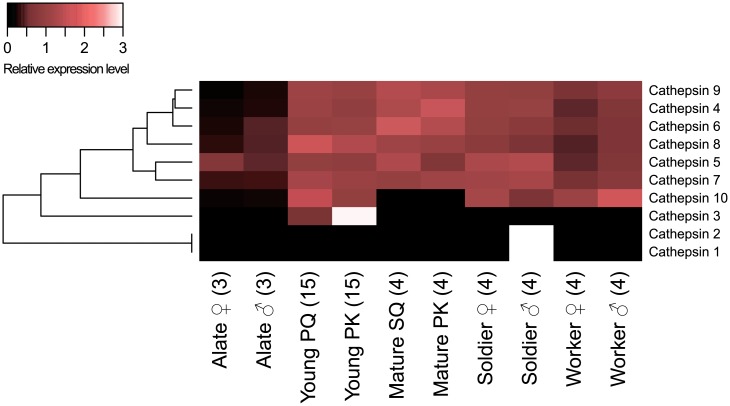
Fig 3. Differential expression of cathepsins among castes.
The heatmap indicates the differential expression of 10 cathepsin transcripts among castes. Abbreviations are as indicated in Fig 1. Relative expression level indicates the mean normalized CPM, ranging from black (scaled expression of 0) to white (scaled expression of 3.0). The tree at the left corresponds to hierarchical clustering of cluster-averaged expression.

