
Fig 2. Randomization scheme to estimate the ranges of the threshold parameters.
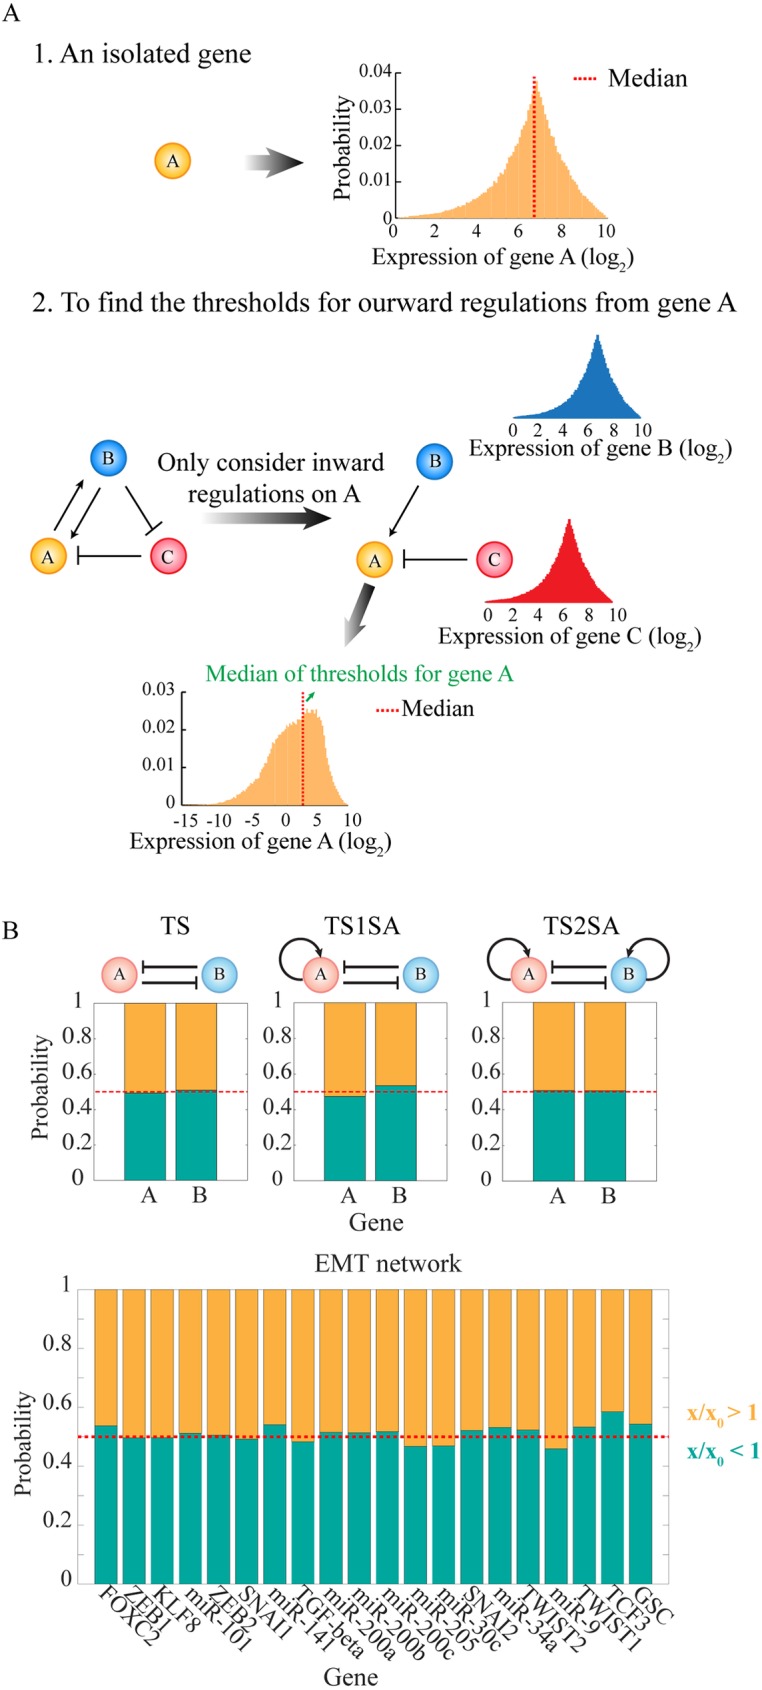
(A) Schematic of the procedure to estimate the ranges of the threshold parameters, so that the level of a regulator has 50% chance to be above or below the threshold level of each regulatory link (“half-functional rule”). First, for a gene A without any regulator, the RACIPE models are generated by randomizing the maximum production rate and the degradation rate according to S1 Table. The distribution of A level is obtained from the stable steady state solutions of all the RACIPE models (top left panel, yellow histogram). Second, for a gene A in a gene circuit, the distribution of A level is estimated only on the basis of the inward regulatory links (i.e. the B to A activation and the C to A inhibition in the bottom left panel). The distributions of the levels of the inward regulators B and C are assumed to follow the same distributions as a gene without any regulator (bottom left panel, blue and red distribution); the threshold levels for these inward links are chosen randomly from (0.02M to 1.98M), where M is the median of their gene expression distributions. Finally, the distribution of A level is obtained by randomizing all the relevant parameters. That includes the levels of B and C, the strength of the inward regulatory links (i.e., the threshold level, the Hill coefficient and the fold change), the maximum production rate and the degradation rate of A, and the threshold for any regulatory link starting from A is chosen randomly from (0.02M to 1.98M), where M is the median level of the new distribution of A level (orange in the bottom panel). The same procedure is followed for all other genes. (B) Tests on several simple toggle-switch-like circuit motifs and the Epithelial-to-Mesenchymal Transition (EMT) circuit show that the “half-functional rule” is approximately satisfied with this randomization scheme. For each RACIPE model, we computed the ratio (x/x0) of the level of each gene X at each stable steady state (x) and the threshold (x0) for each outward regulations from gene X. The yellow region shows the probability of x/x0 > 1 for all the RACIPE models, and the green region shows the probability of x/x0 < 1.