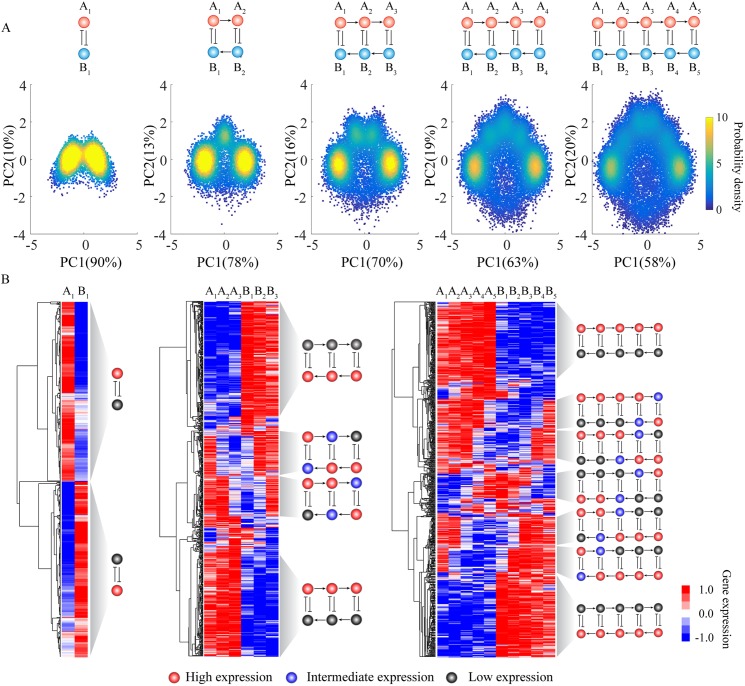
Fig 5. Application of RACIPE to coupled toggle-switch circuits.
RACIPE was tested on coupled toggle-switch circuits, as illustrated at the top of the figure. (A) 2D probability density map of the RACIPE-predicted gene expression data projected to the 1st and 2nd principal component axes. (B) Average linkage hierarchical clustering analysis of the gene expression data from all the RACIPE models using the Euclidean distance. Each column corresponds to a gene, while each row corresponds to a stable steady state. The clustering analysis allows the identification of several robust gene states, whose characteristics were illustrated as circuit cartoons to the right of the heatmaps. The expression levels of each gene in these gene states are illustrated as low (grey), intermediate (blue), or high (red). See S6 and S7 Figs for the definitions.

