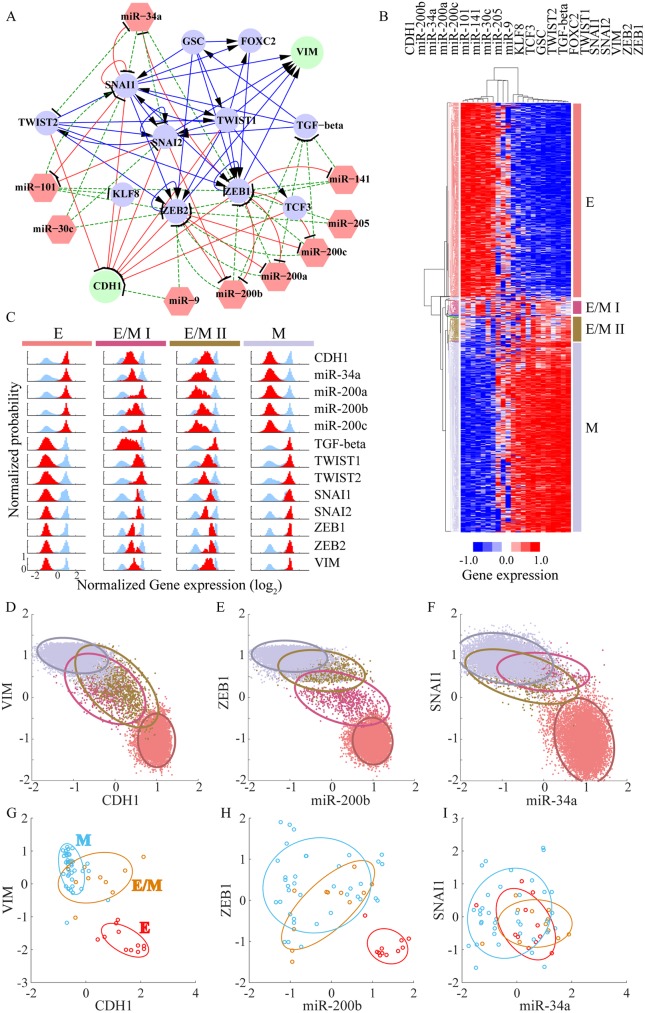
Fig 6. RAICPE identifies multiple EMT cell states from gene network analysis.
(A) A proposed Epithelial-to-Mesenchymal Transition (EMT) circuit is constructed according to the literature; the circuit consists of 13 transcriptional factors (circles), 9 microRNAs (red hexagons) and 82 regulatory links. The blue solid lines and arrows represent transcriptional activations, the red solid lines and bars represent transcriptional inhibition, and the green dashed lines and bars stand for translational inhibition. Two readout genes CDH1 and VIM are shown as green circles while the other transcriptional factors are shown in blue. (B) Average linkage hierarchical clustering analysis of the gene expression data from all the RACIPE models using the Euclidean distance. Each column corresponds to a gene, and each row corresponds to a stable steady state. Four major gene states were identified and highlighted by different colors. According to the expression levels of CDH1 and VIM, the four gene states were associated with epithelial (E in red), mesenchymal (M in grey) and two hybrid epithelial/mesenchymal (E/M I in purple and E/M II in brown) phenotypes. (C) The gene expression distribution of each gene state. The gene expression distribution of each gene for all of the RACIPE models is shown in blue, while that for each gene state is shown in red (50 bins are used to calculate the histogram of each distribution). For clarity, each distribution is normalized by its maximum probability. Each row represents a gene and each column represents a gene state. (D-F) Gene expression data were projected to either CDH1/VIM, miR-200b/ZEB1, or miR-34a/SNAI1 axes. Different gene states are highlighted by the corresponding colors and enclosed by the ellipses. (G-I) Transcriptomics data from the NCI-60 cell lines were projected to either CDH1/VIM, miR-200b/ZEB1, or miR-34a/SNAI1 axes. The NCI-60 cell lines have been grouped into E, E/M and M phenotypes according to the ratio of the protein levels of CDH1 and VIM. Different gene states are highlighted by the corresponding colors and enclosed by the ellipses.

