Figure 1.
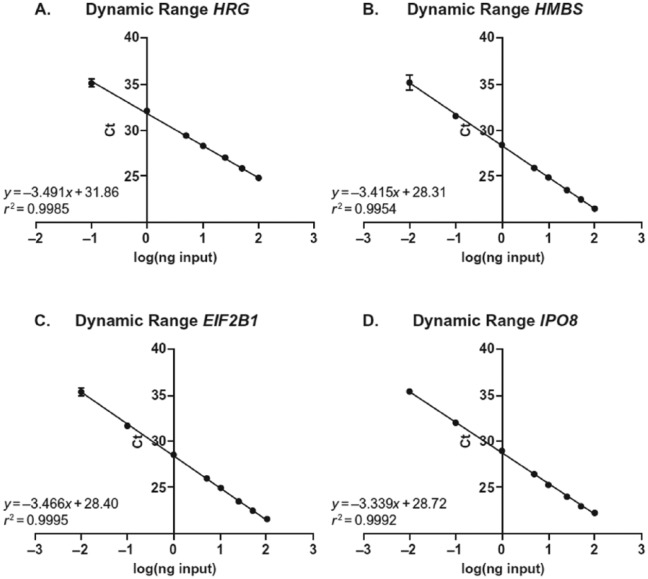
PCR efficiency and linearity for HRG and 3 housekeeping genes: (A) HRGa,b (B) HMBSb, (C) EIF2B1b, and (D) IPO8b. Ct values as a function of input template. Ct indicates cycle threshold.
aThe HRG figure represents a 7-point curve analysis due to no amplification seen in lowest point of 0.01 ng RNA.
bEach point represents the mean Ct across 6 runs.

