Figure 4.
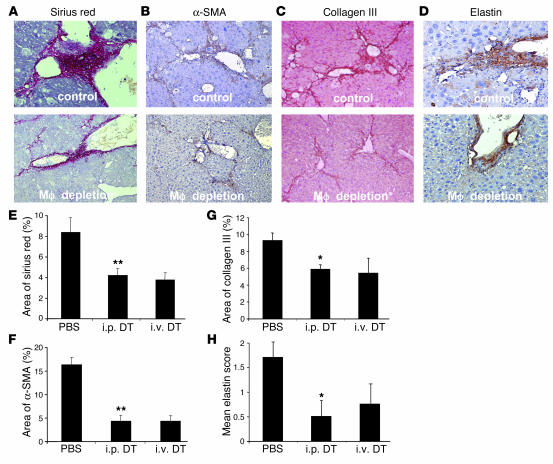
Components of the fibrotic response at peak fibrosis following CCl4 injury in the CD11b-DTR mouse, from control and macrophage-depleted animals. (A) Sirius red staining (magnification, ×200) at 12 weeks after CCl4 injury with no depletion or macrophage depletion. Note extensive perisinusoidal fibrosis that is lost with macrophage depletion. (B) Extensive α-SMA–positive HSCs (magnification, ×200) in the fibrotic bands are seen with no depletion but not following macrophage depletion. (C) Collagen III staining (magnification, ×100) showing both fibrotic bands and perisinusoidal fibrosis with no depletion and following depletion. (D) Elastin staining (magnification, ×200) with no depletion or macrophage depletion. Macrophage depletion during CCl4 injury results in (E) a reduction of sirius red staining and (F) a reduction of area of α-SMA–positive HSCs. (G) Collagen III and (H) elastin are reduced in fibrotic matrix following macrophage depletion (*P < 0.05, ** P < 0.01).

