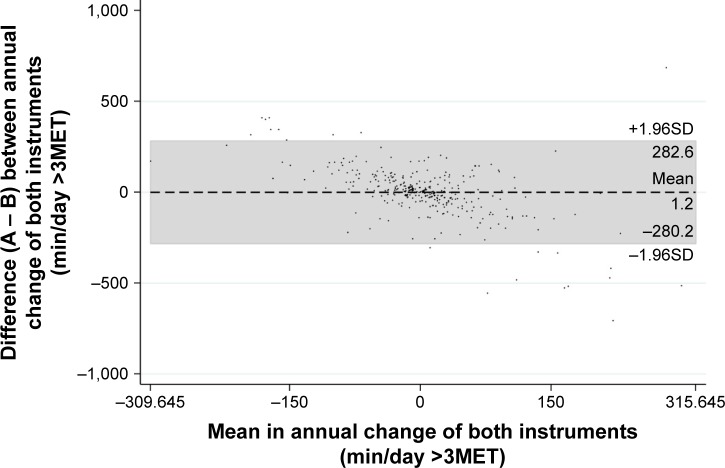
Figure 3.
Bland–Altman plot of differences between the annual change of objectively measured (A) and self-reported (B) physical activity against their mean.
Note: The mean difference and limits of agreement (±1.96SD) are represented by the dashed line and the gray marked area, respectively.
Abbreviations: MET, metabolic equivalent of task; SD, standard deviation.

