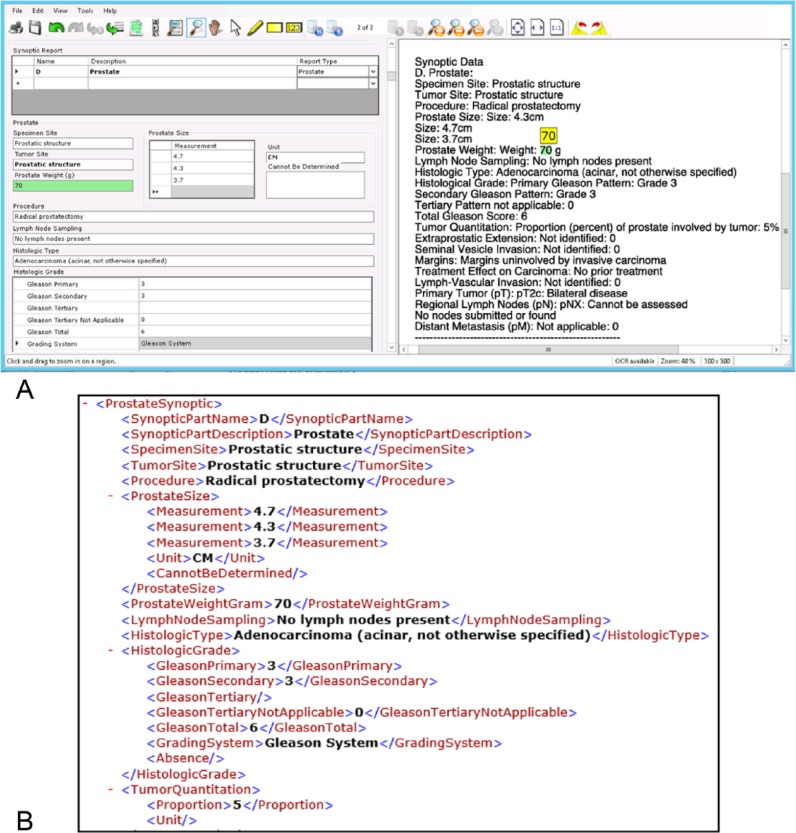
Figure 3.
An example of pathology report data extraction using Extract Systems software. (A) After the software performs automatic data detection and extraction, the verification software interface displays the report-in-process on right-hand side of screen, to be compared with the extracted information on dynamically generated data form on the left side. Screen capture shows an example section containing part of a synoptic pathology report. Please note one selected data element (in green) with its highlighted counterpart on the original report for easy verification. (B) Corresponding section of the resulting XML output file was subsequently loaded into the Warehouse.

