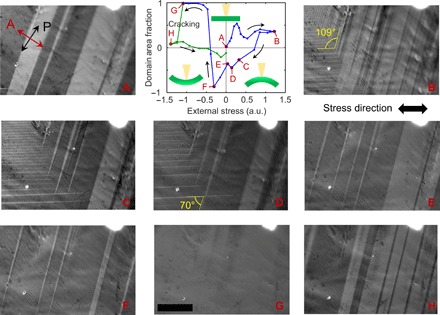
Fig. 2. Evolution of the domain structure in sample C under external stress.

Domain area fraction (F) versus applied uniaxial stress graph and polarized light micrograph images corresponding to letter labels. Arrows indicate the sequence of the applied stress throughout the experiment. (A) to (H) Correspond to selected points on the graph. Application of tensile stress (positive) leads to shifts of domain boundaries and formation of new types of domains (tilted 70° and 109° to the old domains). A prominent nonlinearity is observed. Compressive stress eventually erases all domains and, after point G (where only one bright domain exists in the field of view), leads to fracturing (cracking) of the crystal and to a drastic change in the domain structure. Data points following cracking are marked in green. Uncertainty in the F values was estimated to be ≈0.03, taken as the largest of the uncertainties calculated from selected points in the graph (see Materials and Methods for details). Scale bars, 10 μm. The domain area fraction was calculated for a field of view larger than shown (530 μm × 710 μm). Micrographs were grayscaled. The graph insets show schematics of sample bending relative to the incident light (yellow cone). Stress in the graph is shown in arbitrary units (a.u.).
