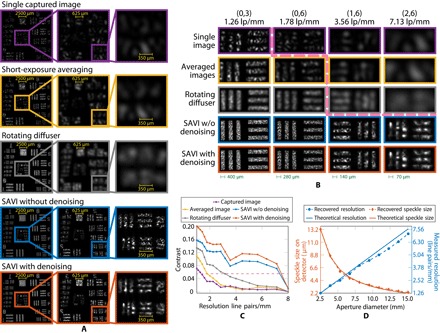
Fig. 4. FP for improving spatial resolution in diffuse objects.

A USAF resolution target is used to characterize the performance of the proposed method to create SAVI. (A) Resolution of a USAF target under coherent light under various imaging modalities. First row: Captured images exhibit large diffraction blur and speckle. Second row: Averaging short-exposure frames of a vibrating target reduces speckle. Third row: A rotating diffuser removes temporal coherence to approximate an incoherent source at the expense of light efficiency. Fourth row: SAVI without the denoising step described in the “Suppressing speckle” section in Materials and Methods. Fifth row: SAVI using denoising improves the contrast of the fourth row. (B) Magnified regions of various bar groups recovered by the five techniques. The pink line demarcates resolvable features. Scale bars at the bottom of each column show the size of a single bar in that column. (C) Contrast of the bars as a function of feature size. Features above the pink dashed line are resolvable. Resolution in the captured image deteriorates rapidly (purple). Mimicking an incoherent source via averaging (yellow) or rotating diffuser (gray) increases spatial resolution. SAVI without (blue) and with (orange) a regularizer markedly increases resolution. Use of the regularizer improves image contrast. See the main text for a complete explanation of the contrast metric. (D) Speckle size and resolution loss are inversely proportional to the size of the imaging aperture. By increasing the synthetic aperture to just over six times the size of the camera’s aperture, we observe a sixfold increase in resolution (blue lines and circles) accompanied by a corresponding decrease in speckle size (orange lines and diamonds). The measured and predicted values are shown in dashed and solid lines, respectively. Speckle size computed without the use of the denoising regularizer. Note that the slight deviation of measured improvement is a consequence of discretization of the resolution chart. See fig. S4 discussed in part D of the Supplementary Materials for further details.
