
Figure 2.
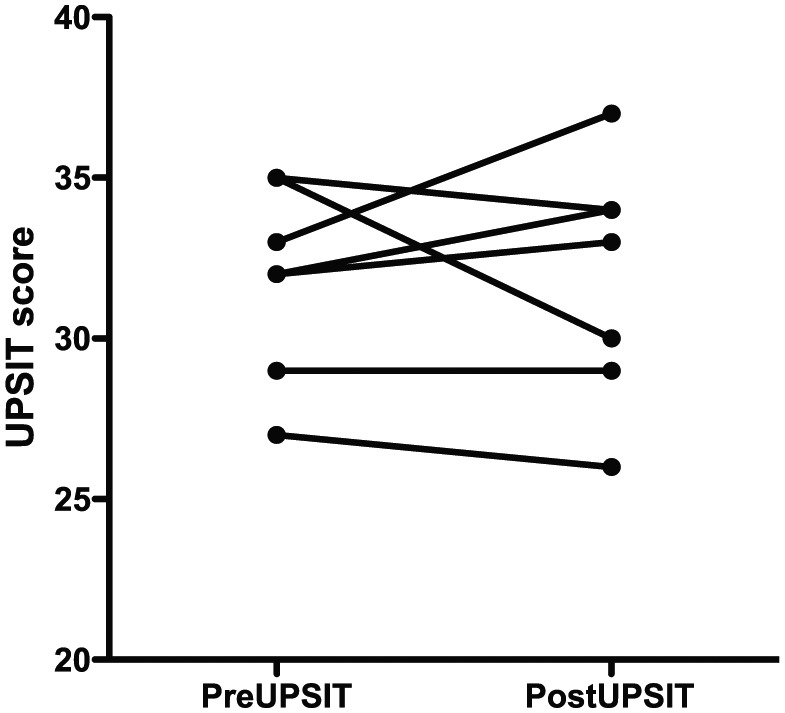
Scatter plot of UPSIT results in eight subjects undergoing biopsy procedure. Prebiopsy 32.0 ± SEM 1.04; postbiopsy 32.0 ± 1.23, paired t = 0.13, P = 0.9. Notes: two subjects had same values and are seen as one line on the graph; five patients did not perform postbiopsy testing and are not included.