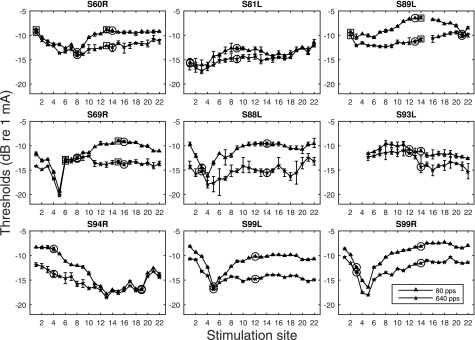
FIG. 1.
Psychophysical detection thresholds measured for two stimulation rates across the electrode array. The error bars represent the range of the data (high and low thresholds). The stimulation sites chosen to be tested for spatial selectivity are indicated by circles. A second pair of electrodes was chosen for three subjects and is indicated by squares.

