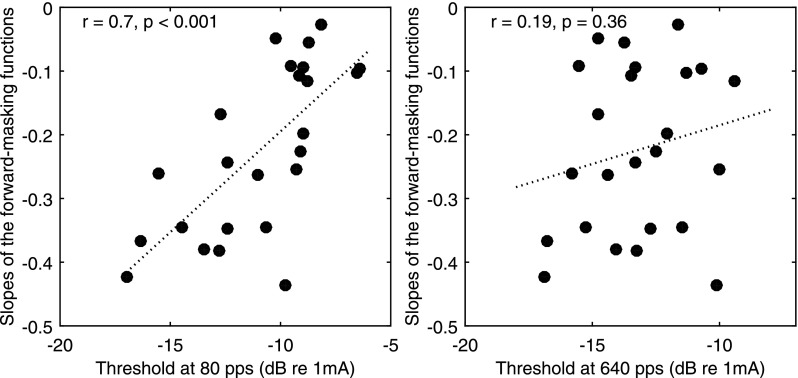
FIG. 7.
Scatter plots of the slopes of the forward-masking functions against the 80-pps (left) and 640-pps (right) detection thresholds. Each data point represents one stimulation site (n = 24). The dotted line shows the linear fit to the data. The correlation coefficients and the p values are shown in the upper left corner of each panel.

