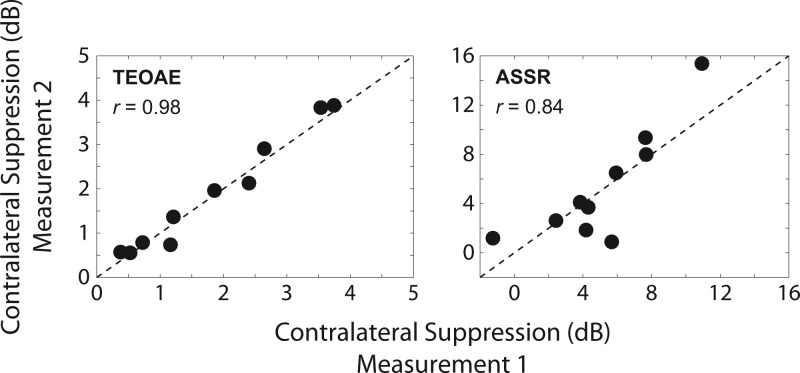
FIG. 6.
Test–retest reliability of contralateral suppression of TEOAEs (left panel) and of ASSRs (right panel). Results are plotted as the contralateral suppression value obtained in the second measurement against that of the first measurement (note the different ordinate scales). The filled circles represent data from each individual subject. The dashed line represents a 1:1 correspondence between the results at each measurement. Both measures exhibited high test–retest reliability within a session.

