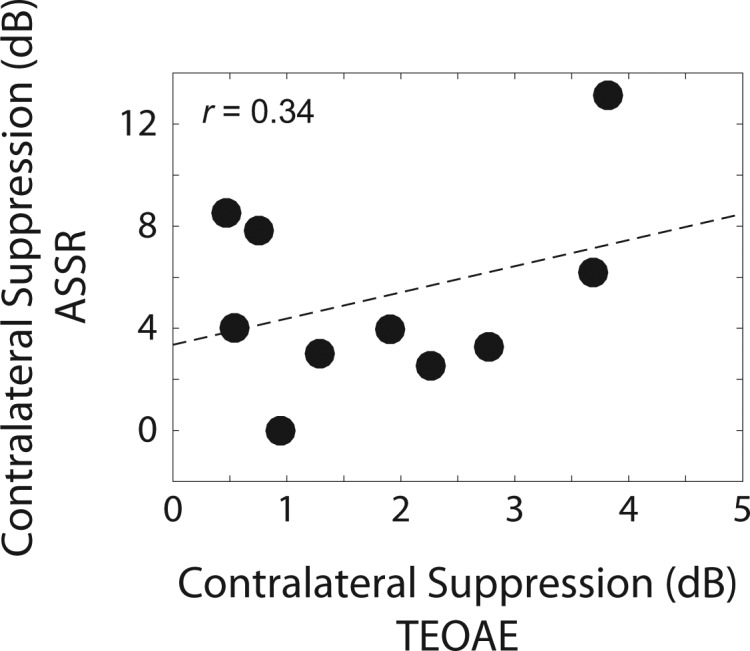
FIG. 8.

Association between contralateral suppression of TEOAEs and of ASSRs. The filled circles represent data from individual subjects. The dashed line represents a least-squares fit to the data. The correlation between the two measures was not significant.
