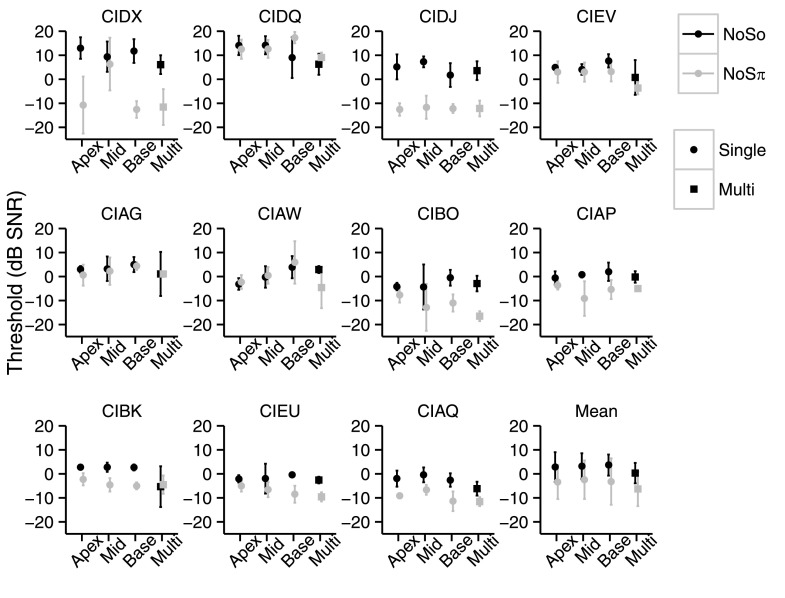
FIG. 2.
NoSo (black) and NoSπ (gray) thresholds (dB SNR) of the children with CIs for each stimulation condition. Each panel shows the data of an individual child except for the last panel which shows the mean thresholds. Single-electrode-pair stimulation is shown by circles and multi-electrode-pair stimulation is shown by squares. Error bars represent ±1 standard deviation.

