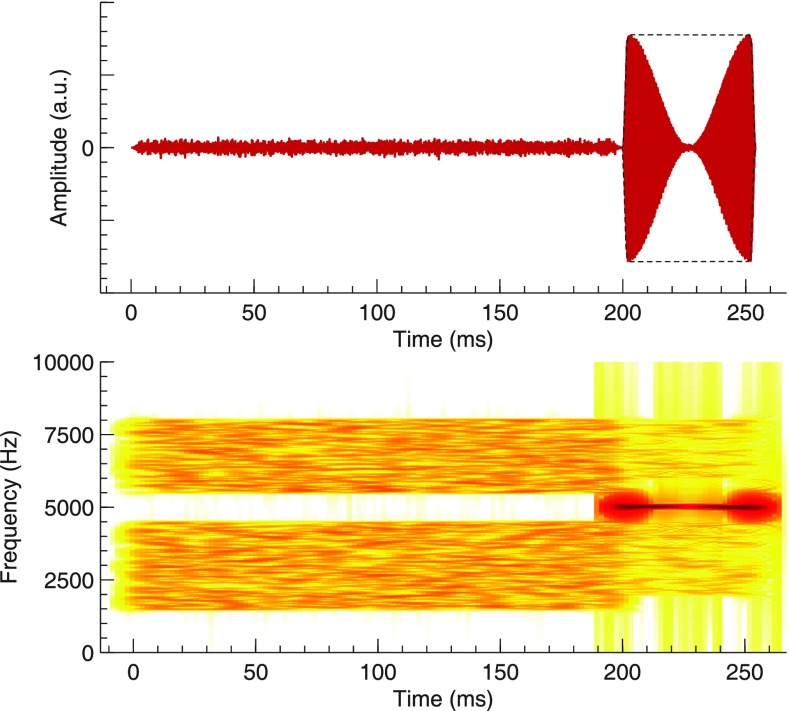
FIG. 2.
(Color online) Time waveform (top) and spectrogram (bottom) of the 200-ms, notched-noise precursor, followed by the 50-ms (plus 2-ms rise/fall ramps) narrowband, amplitude-modulated carrier. The dashed line in the top panel shows the envelope of the unmodulated carrier. Off-frequency listening was limited by gating an additional notched noise with the carrier. For the spectrogram, dark colors represent relatively higher amplitudes, while light colors represent relatively lower amplitudes. (a.u.: arbitrary units.)

