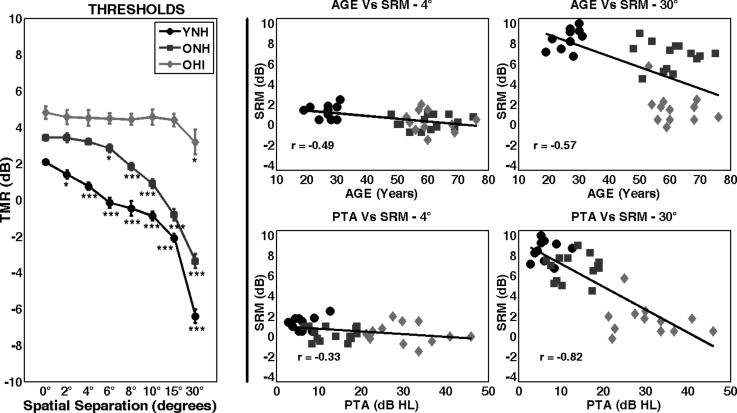
Fig. 1.
(Color online) (Left) Target-to-masker ratios plotted as a function of spatial separation between the target and maskers for the three listener groups. Error bars are ±1 standard error of the mean. Significant difference between spatially separated and co-located thresholds at the level of p < 0.001 are indicated by *** and p < 0.05 are indicated by *. (Right) SRM as a function of age (top row) and PTA (bottom row) at 4° and 30° separations. The solid lines are the least squares fits to the data. All correlations are significant at p < 0.05.

