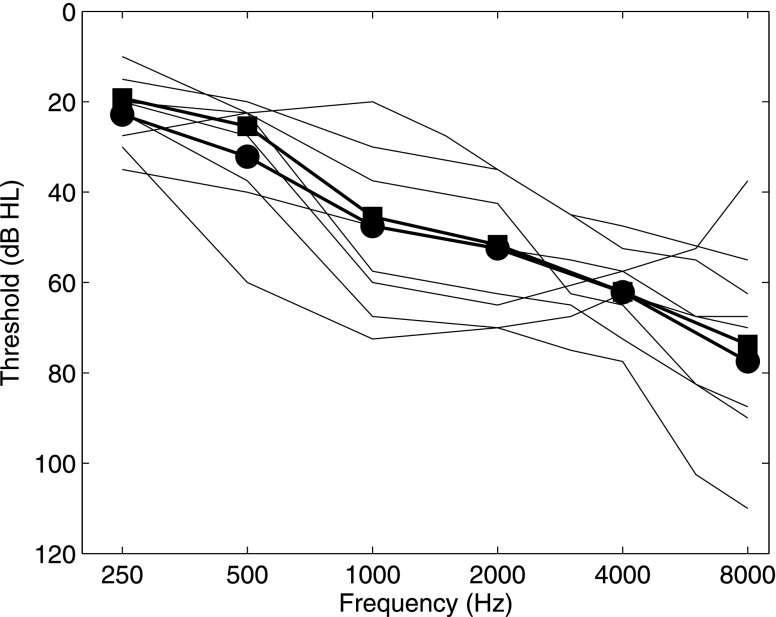
FIG. 1.
Individual audiograms for the eight hearing-impaired listeners who participated in the study (thin lines; averaged across left and right ears). Also shown is the across-subject mean for the seven listeners whose data were ultimately included in experiments 1 and 2 (thick lines and circles), and the across-subject mean for the six listeners on which the filtering for experiment 3 was based (thick lines and squares).

