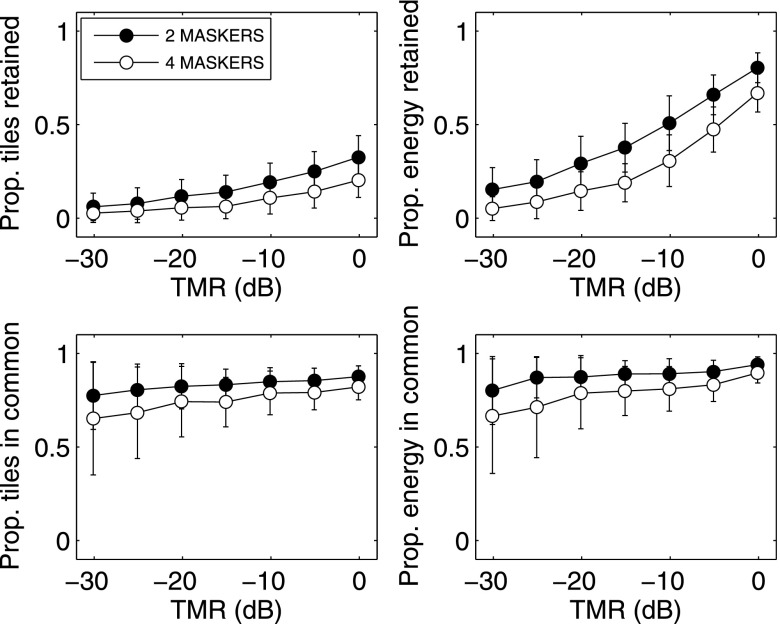
FIG. 2.
Top row: Proportion of time-frequency tiles (left) and energy (right) retained in one ear after application of the glimpsing model, as a function of TMR and number of maskers. Bottom row: Proportion of tiles (left) and energy (right) retained that were also retained in the other ear. Error bars indicate standard deviations across 100 simulated trials.

