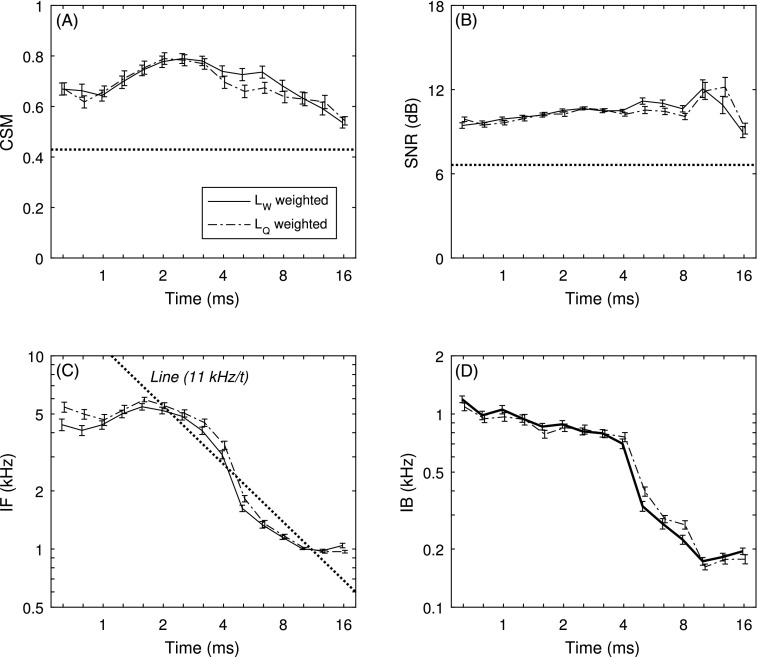
FIG. 7.
Plots versus time are shown for the LW and LQ conditions for (A) CSM, (B) SNR, (C) IF, and (D) IB. The critical CSM and SNR values are shown in horizontal dotted lines in A and B. The straight dotted line (with t in ms) in (C) represents the predicted IF for a human ear with a cochlear scale symmetry. Data are offset horizontally to aid in visualizing the SEs.

