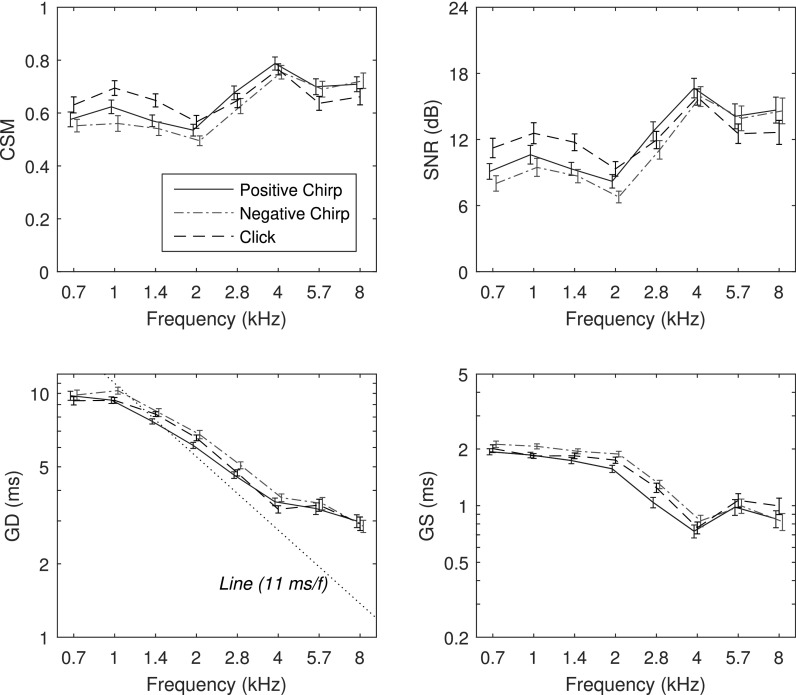
FIG. 10.
(Color online) Adult group data in the frequency domain (mean ±1 SE): CSM (top left), SNR (top right), GD (bottom left), and GS (bottom right). CSM and SNR statistics were calculated over all test ears. GD and GS statistics were calculated at each frequency for those ears with TEOAEs present based on CSM and SNR, respectively.

