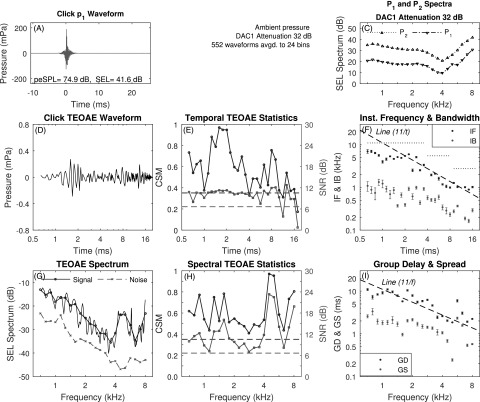
FIG. 2.
(Color online) Click TEOAE with three-window averaging (test ear A). A: mean p1 waveform. Panel B intentionally absent to facilitate comparisons with Figs. 3 and 5. C: mean P1 and P2 spectra. D: mean pd waveform. E: CSM and SNR vs time. F: IF and IB vs time (reference dashed line proportional to 1/t with IF of 11 kHz at 1 ms). Horizontal dotted lines show Nyquist frequency over three sets of time bins. G: TEOAE signal and noise spectra (fine structure, thin solid line). H: CSM and SNR vs frequency. I: GD and GS vs frequency (reference dashed line proportional to 1/f with GD of 11 ms at 1 kHz). Horizontal dashed lines in E and H show CSMcrit and SNRcrit.

