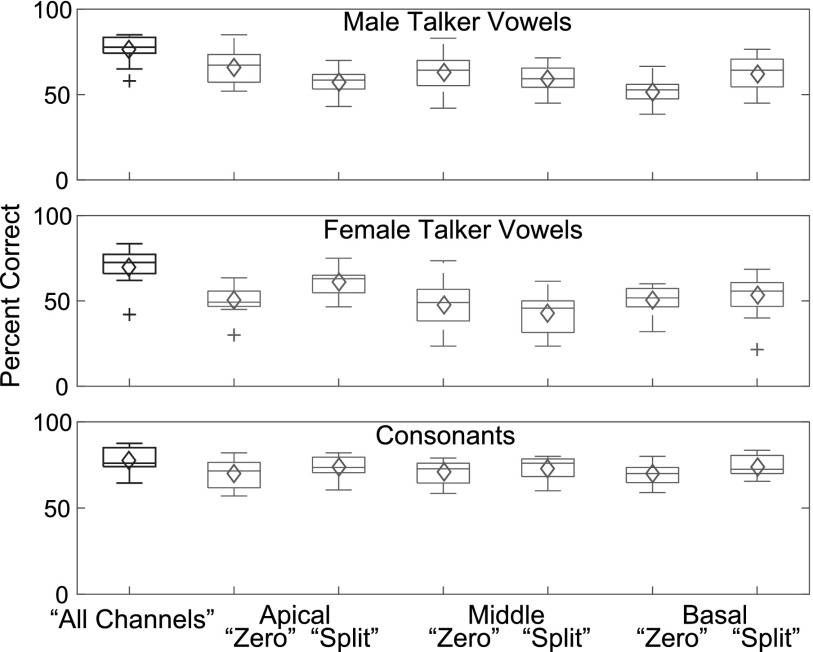
FIG. 4.
(Color online) Vowel and consonant identification performance. Box plots depict the average performance across subjects for each condition for each phoneme list. Lower and upper end of the boxes indicate the 25th and 75th percentiles, respectively. Whiskers extend from the third quartile to the highest value that is +1.5 × the interquartile range and from the first quartile to the lowest value that is −1.5 × the interquartile range. Plus signs indicate outliers. The middle line of each boxplot is the median and the diamond symbols represent the mean.

