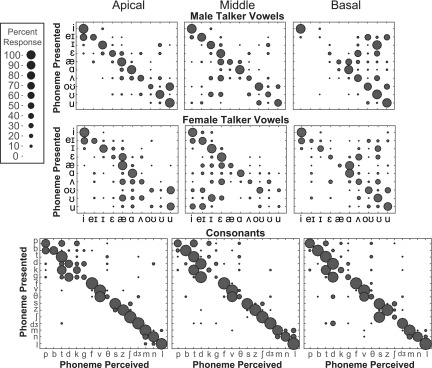
FIG. 6.
(Color online) Confusion matrices for the zero vocoder manipulation for each frequency region. Responses are plotted as phoneme presented (ordinate) vs phoneme perceived (abscissa). Percent responded is indicated by circle size, such that larger circles indicate higher percentage of response. Vowels are ordered according to vowel space (see Fig. 1), starting with “heed” and moving counterclockwise. Adjacent vowels have similar second formants and vowels opposite each other have similar first formants. Consonants are ordered by manner of articulation (stops, fricatives, affricates, nasals, and liquid).

